Deep Learning for EEW
Early Warning for Great Earthquakes From Characterization of Crustal Deformation Patterns With Deep Learning (2021). Journal of Geophysical Research-Solid Earth

Why EEW Systems?
Large earthquakes and resulting tsunamis can have devastating impacts. According to reports from the FEMA (Federal Emergency Management Agency) and the USGS (U.S. Geological Survey), earthquakes cause an estimated $6.1 billion in annual economic losses in the U.S. and are a frequent source of casualties. EEW (Earthquake Early Warning) systems are designed to provide critical advance notice, from a few seconds to several minutes, allowing individuals and automated systems to take protective action before strong ground shaking or tsunami waves arrive.Why Deep Learning?
Earthquakes are complex in time and space
The existing models estimate earthquake magnitude by the earliest metrics of rupture signal-P waves from the near-field. However, there are three well-known issues in the current systems. First, sensitive broadband sensors can be distorted and clipped in the near-field during strong shaking. Second, the amplitude spectrum of large earthquakes saturates at higher frequencies, where accelerometers are most sensitive (this is called magnitude saturation). Finally, the early signal of rupture may not provide the final information about the rupture (this is called non-determinism). As a result, determining large earthquake sources "quickly" and "accurately" has been proven to be challenging. This is a trade-off between accuracy & warning time.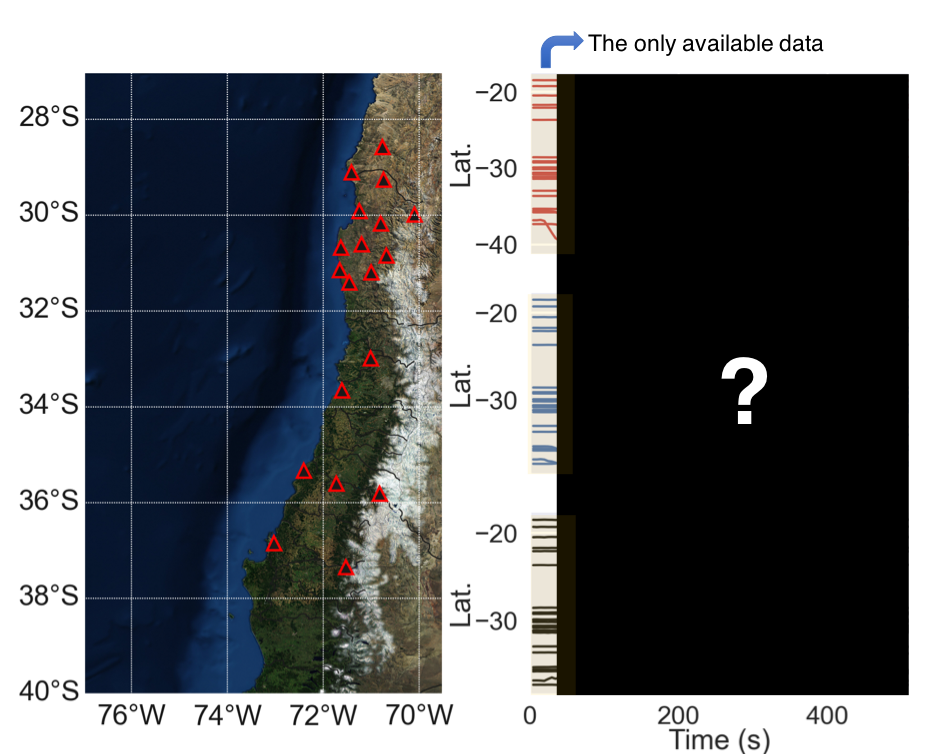
2010 Mw8.8 Maule earthquake: Magnitude, Location, and Source Extent prediction (blue rectangle)
Earthquake Source Joint Inversion
Overlapping regions of coseismic and transient slow slip on the Hawaiian décollement (2020). Earth and Planetary Science Letters
Why Joint Inversion?
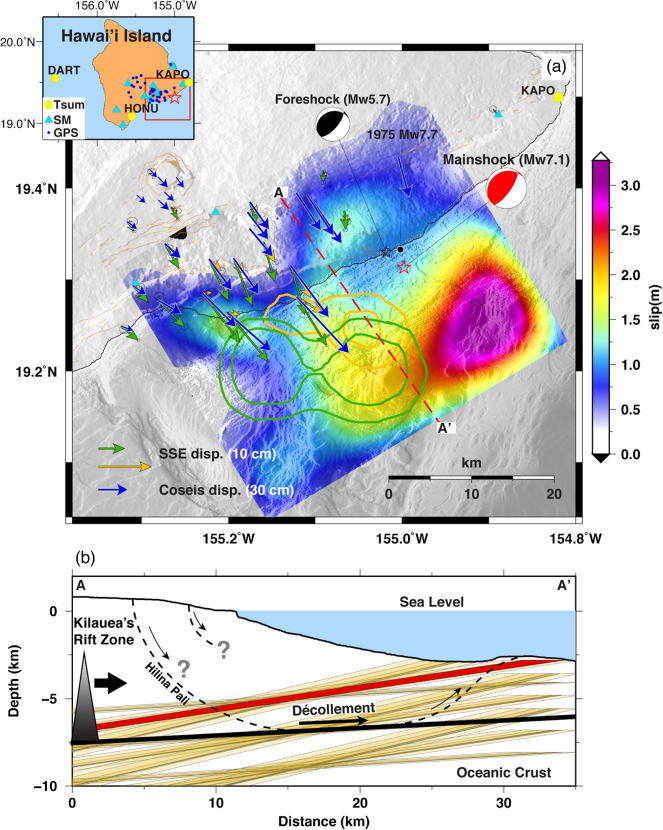
For most of the time we can not see the rupture processes during earthquakes. However, the emitted seismic waves carry the fingerprint of the source. From how large is the slip? how fast the fault has moved? what is the fault geometry? to what is the slip direction and how long is the rupture duration? Inversion is an "reverse engineering", and the goal is to find the source that best produces the observed data. With joint inversion model, we find a model that reconcile different types of data simultaneously, providing a better resolution of the earthquake source process. The figure shows an example of joint (a) GPS coseismic displacement, (c) strong motion accelememoter, and (d) tsunami tide gauges data to reveal the detailed rupture process of the 2018 Hawaii Big Island earthquake [US Geological Survey].
What Did We Find?
In this study, we jointly invert the rupture history of the Mw7.1 2018 May 4 Hawaii earthquake by GPS, strong motion accelerometer, and additionally, calibrated tsunami data with a novel empirical tsunami approach. We explore the model space with more than 2000 inversion models. The result show that the earthquake (fast-slip) ruptured through an adjacent region that regularly hosts slow-slip. Additionally, we perform numerical modeling to simulate fast and slow slip behavior that supports our observations. This suggests that fault limit that usually constrained by coseismic slip is likely not a limit for a big event. As a result, earthquake hazard study should include the adjacent SSE regions for better hazard assessment. Check out our publicationSignals Detection by Cross-correlation and Machine Learning
S Coda and Rayleigh Waves From a Decade of Repeating Earthquakes Reveal Discordant Temporal Velocity Changes Since the 2004 Sumatra Earthquake (2020). Journal of Geophysical Research-Solid Earth
Rayleigh-Love discrepancy highlights temporal changes in near-surface radial anisotropy after the 2004 Great Sumatra Earthquake (2021). Journal of Geophysical Research-Solid Earth

LFE Detection and Why?
Low frequency earthquakes (LFEs) are tiny earthquakes (with magnitude usually <M2) emitting seismic waves with relatively less high frequency contents. Non-volcanic LFEs can occurr at the down dip subduction zone boundary, shallow portion of subduction megathrust, and within the seismogenic zone. The process of LFE is usually associated with fluid interaction or partial melting at a particular pressure-temperature condition. Thus it is an important indicator to identify subduction zone extent, and to understand geological and geophysical properties of the subduction zone environment. The reason why a LFE detection algorithm is necessary is that unlike regular earthquakes, where waveform signals are obvious, LFEs signals are usually unclear and hidden in noisy time-series. The figure shows example of individual LFE data (gray lines), before stacking of many of such data (red line), clear earthquake signals are barely revealed.Traditional: Template Matching
Despite without apparent "waveforms" for each individual event, the most common method to detect LFEs is template matching. In this method a LFE template is pre-defined, new events can be detected when cross-correlating the template and noisy continuous timeseries passes a certain threshold i.e. when the waveform is identical to the template, the correlation coefficient=1. To guarantee the detection is reliable, template matching has to consider the correlation coefficient of multiple stations. The searching procedure can be time consuming and the space complexity is expensive as the network and template grows bigger, but it is currently the most robust method and can be applied to various applications e.g. repeating earthquakes. Check out our publication for application of repeating earthquake searching, coda and Rayleigh waves analysis, and the code for template matching method (click the figure).
New: Deep-Learning
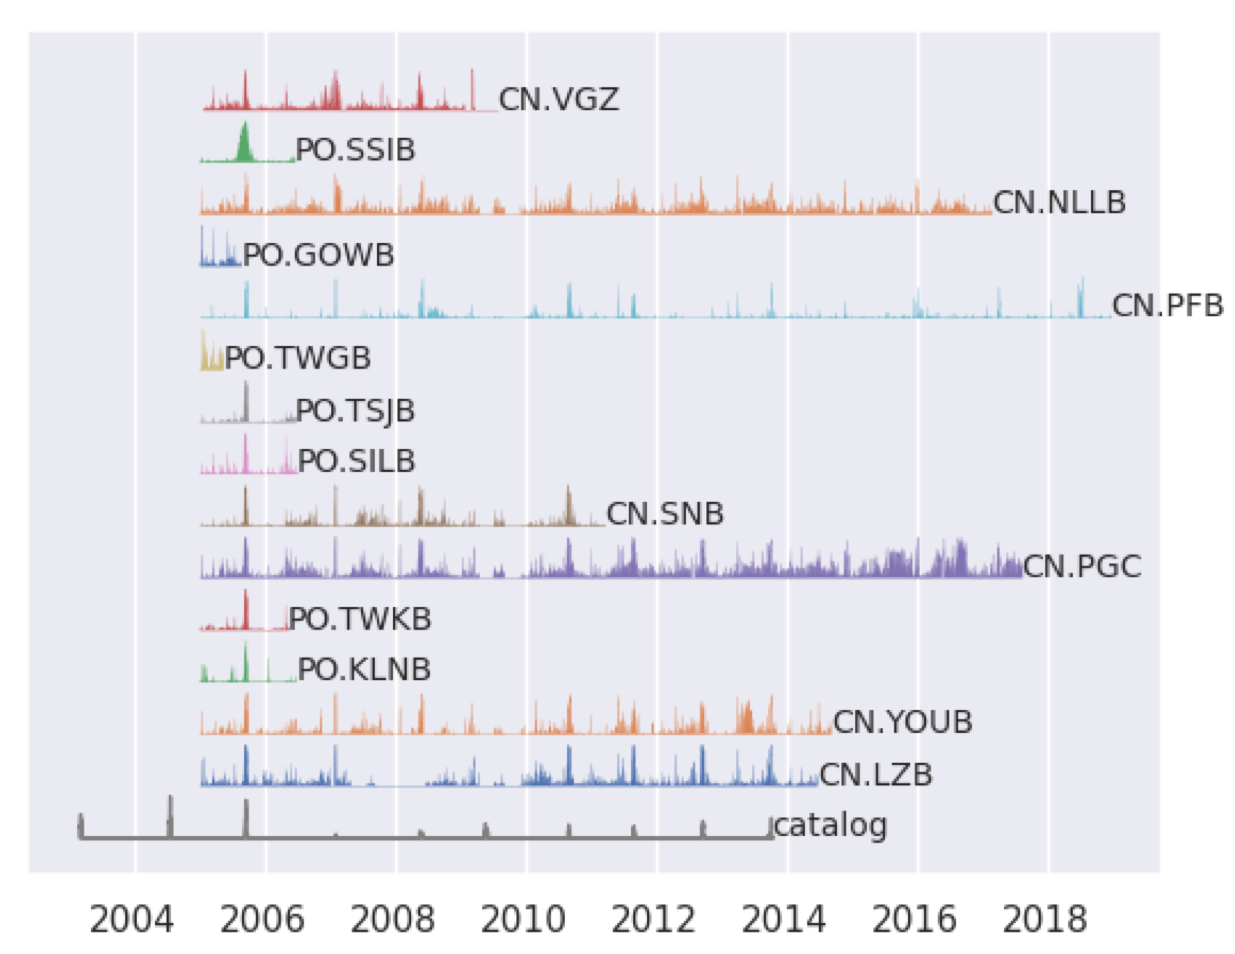
In this study, we follow a U-shaped CNN based model first introduced in Thomas et al. (2021) to identidy LFE waveforms from continuous data in individual stations. The deep-learning model is more computationally efficient than the template matching method once the model has trained. Furthermore, it is more flexable since the detection does not rely on a fixed template, which the arrival times and template waveforms are pre-defined. According to our test it can identify the LFE waveforms from noisy timeseries data with an accuracy of 90%+ and detect new LFEs that are not previously identified. The figure shows the (normalized) number of daily LFE detections at each station. It detects more than 10 millions of arrivals over the 14 stations for over 10 years of recordings. The manuscript is in prep. please check back later for any updates.Earthquake Rupture Simulations with HPC
Why Numerical Simulation?
Large earthquakes are rare, but their physics are not! They are the same as what we frequently observed in moderate and small size events. This is why and how earthquake inversion work i.e. seismologist uses Green's functions, which are small earthquakes, to "synthesize" large earthquake. Simulations can be considered as real earthquakes, and with many of simulations, we can gain insights from them. Example of the applications including probabilistic tsunami hazard assessment (PTHA), earthquake hazard assessment, and most recently, machine-learning models e.g. identifying focal mechanisms, phase associations, P and S waves detection etc. in earthquake sciences.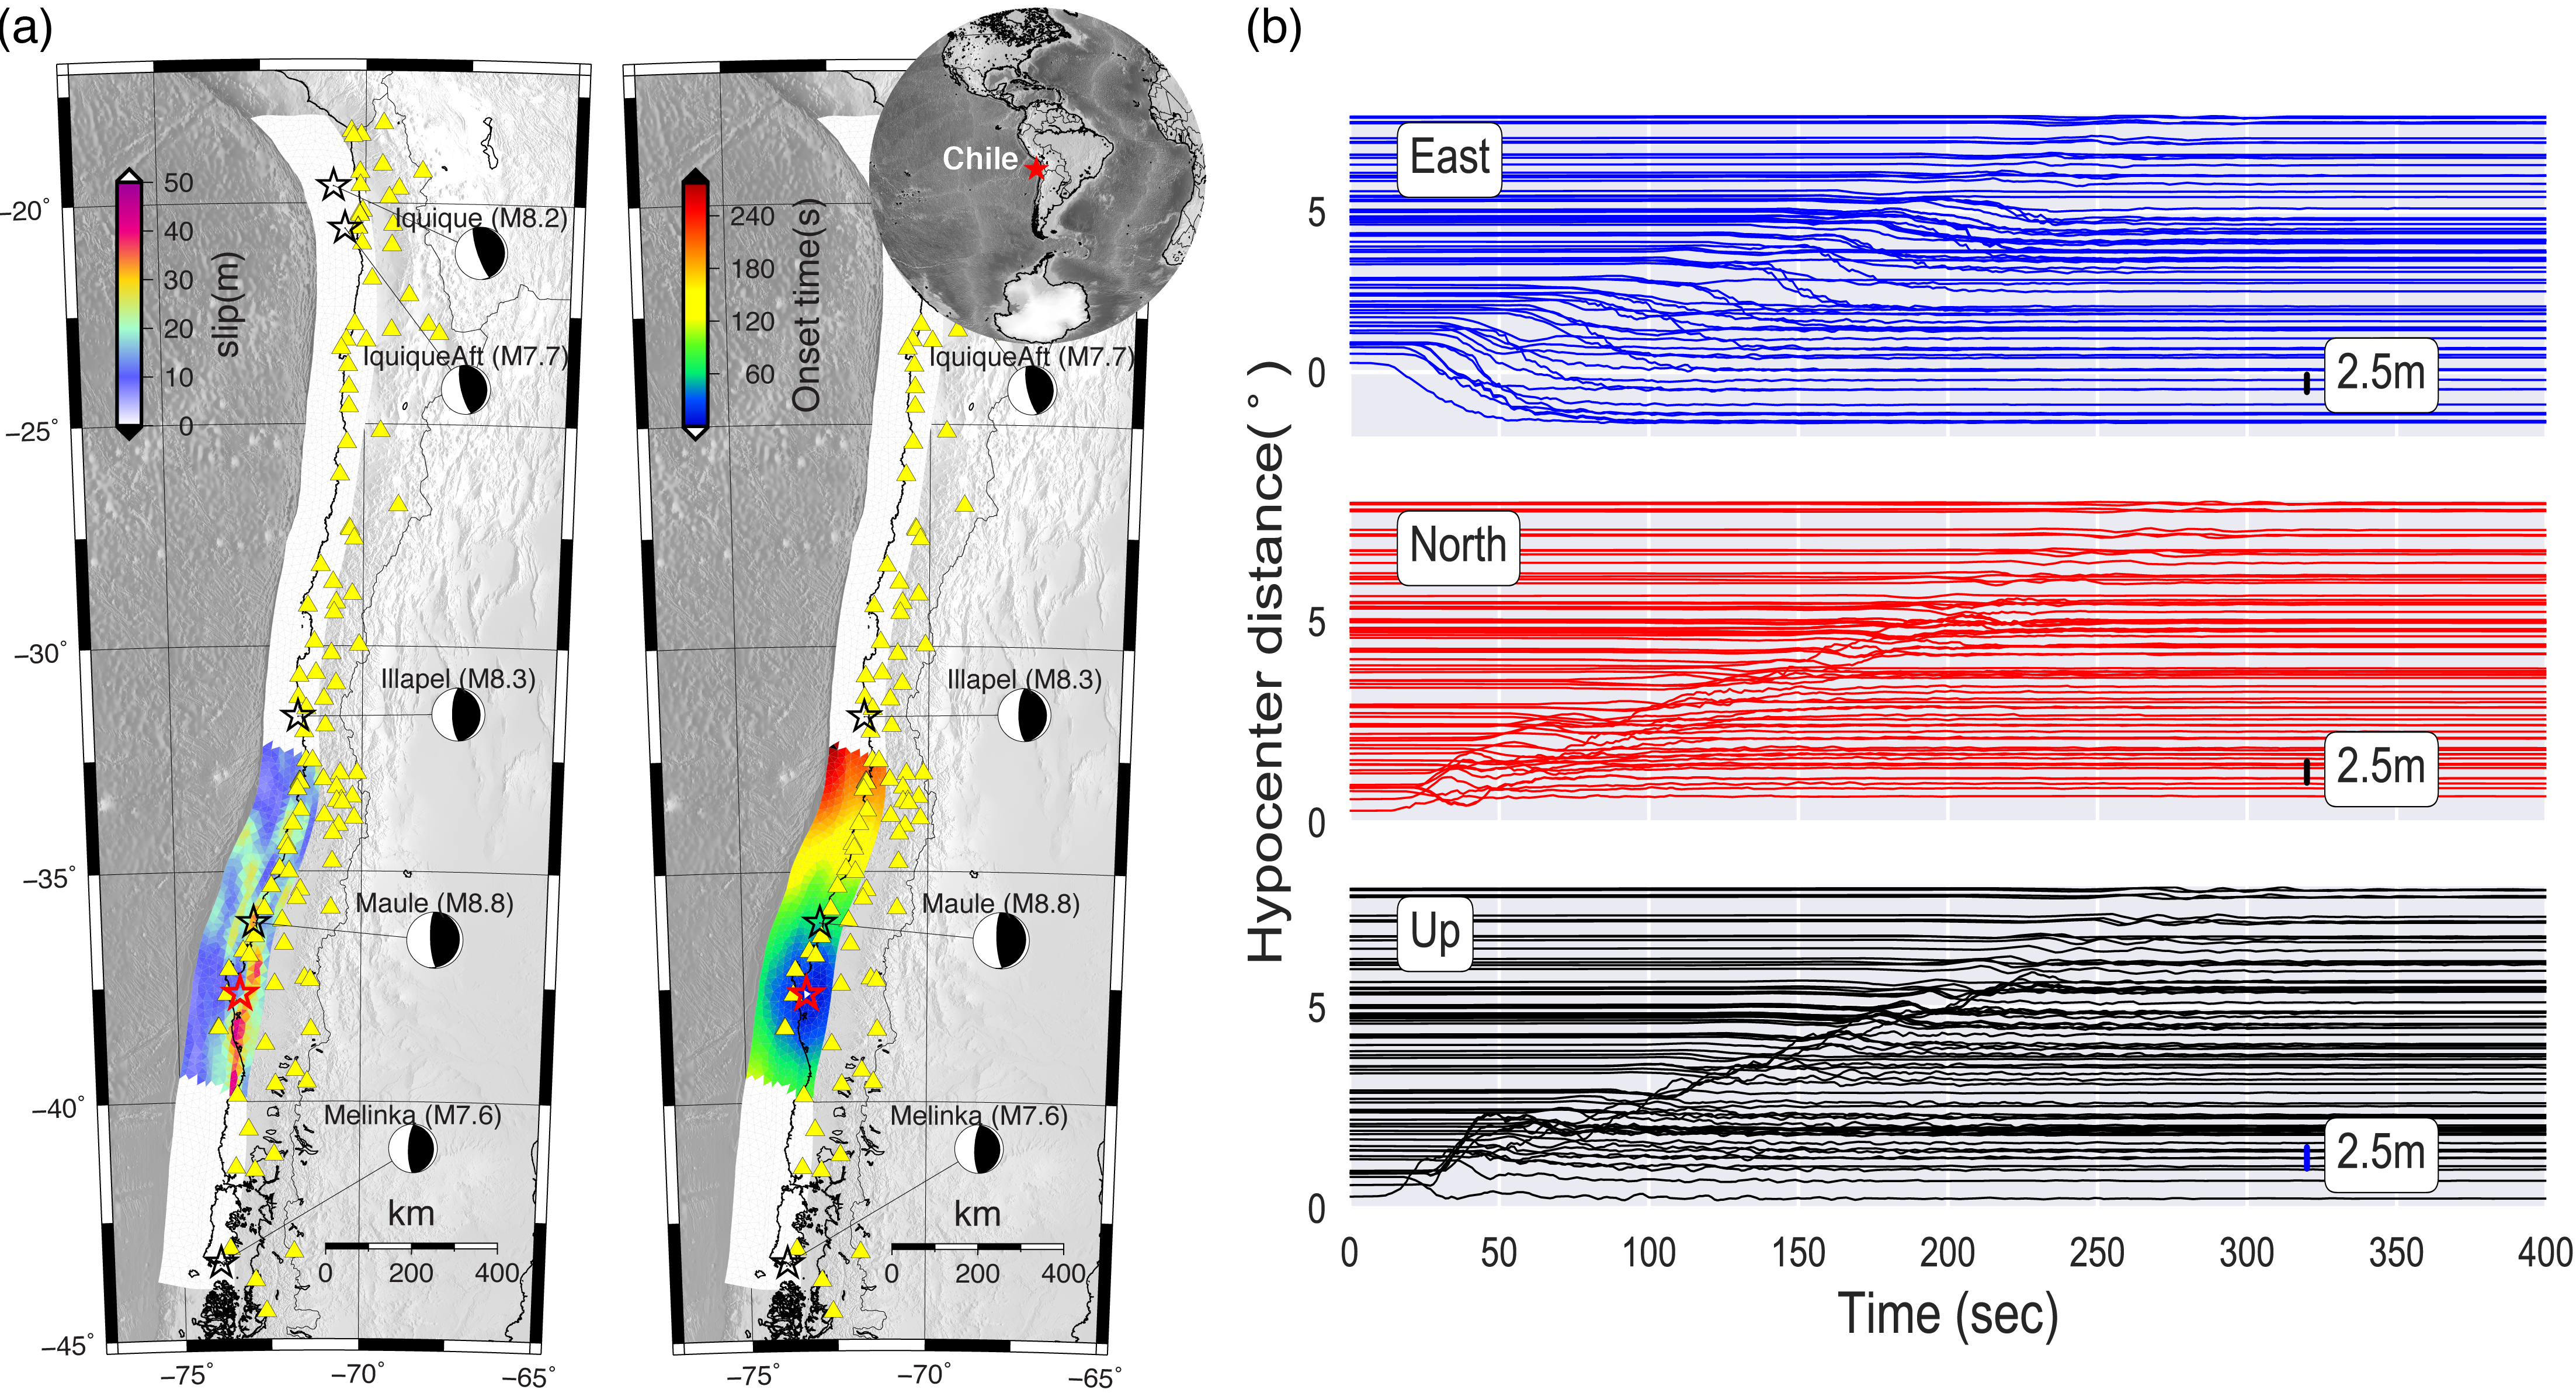
How Do We Simulate?
We apply rupture kinematics and HPC facility- Talapas , to simulate large Chilean earthquakes. Details of the kinematic rupture modeling can be found in Melgar et al. (2016). In this study we simulate thousands of rupture scenarios and ground motion waveforms using Talapas. These earthquakes follow the real global earthquake's source statistic including source duration, fault length, fault width, rupture speed etc. We also apply data augmentation with realistic GNSS noise model and station incompleteness for the synthetic waveforms. The dataset is publicly released and can be downloaded through ZenodoTimeseries Model
Quick determination of earthquake source parameters from GPS measurements: a study of suitability for Taiwan (2019). Geophysical Journal International

Click to see further detail
Function-based regression
Raw GPS time series contains information of long-term plate motion, seasonal variation, earthquake deformation, and noise. By knowing these we build time series models to fit observations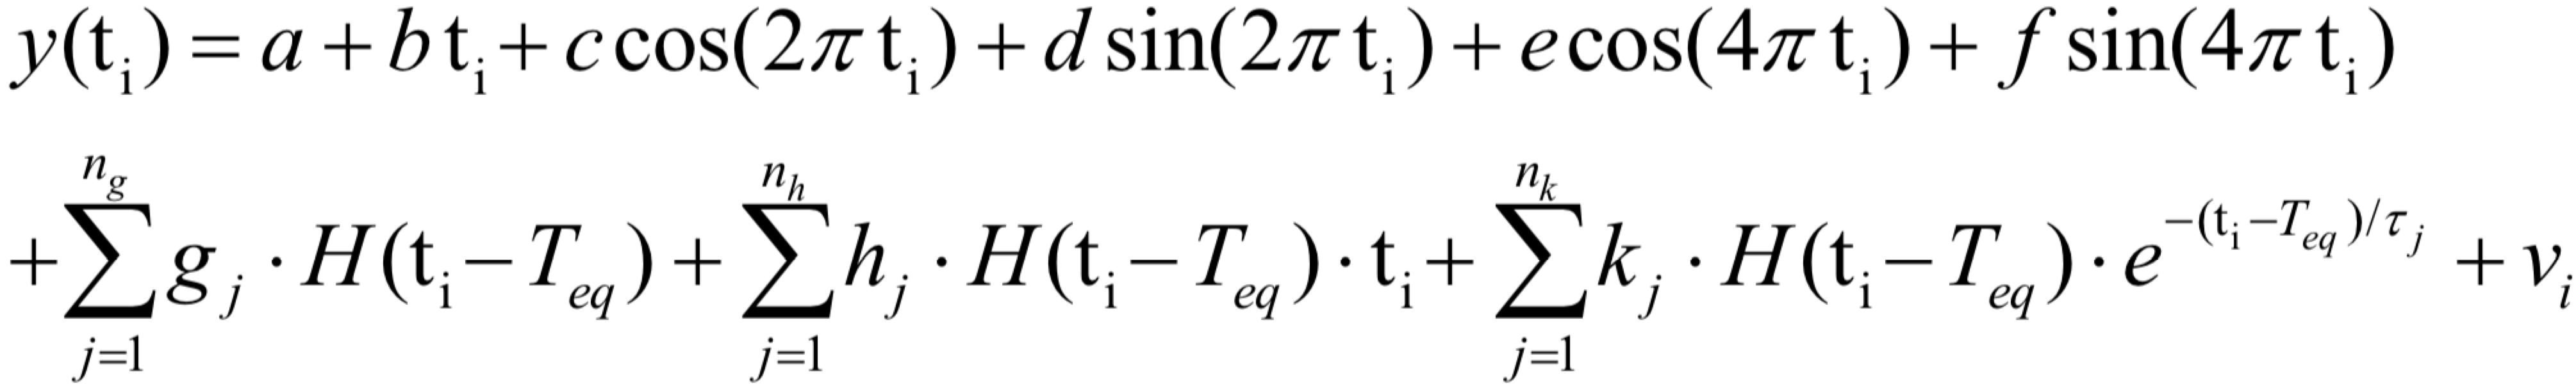 Information such as inter-seismic, co-seismic, and post-seismic deformation can be extracted from the regression model. Our published work can be found
 More coming soon